
Real estate businesses invest in several marketing channels to attract property buyers, sellers, tenants and investors. A brokerage might run Facebook and Instagram campaigns, advertise on Google, publish property listings, maintain a website and receive enquiries through WhatsApp.
The challenge is understanding which activities are actually producing useful business opportunities.
A campaign may generate hundreds of clicks but very few serious buyer enquiries. Another may generate fewer leads but result in more property viewings. Without a clear reporting system, it becomes difficult to compare these campaigns and decide where the marketing budget should go.
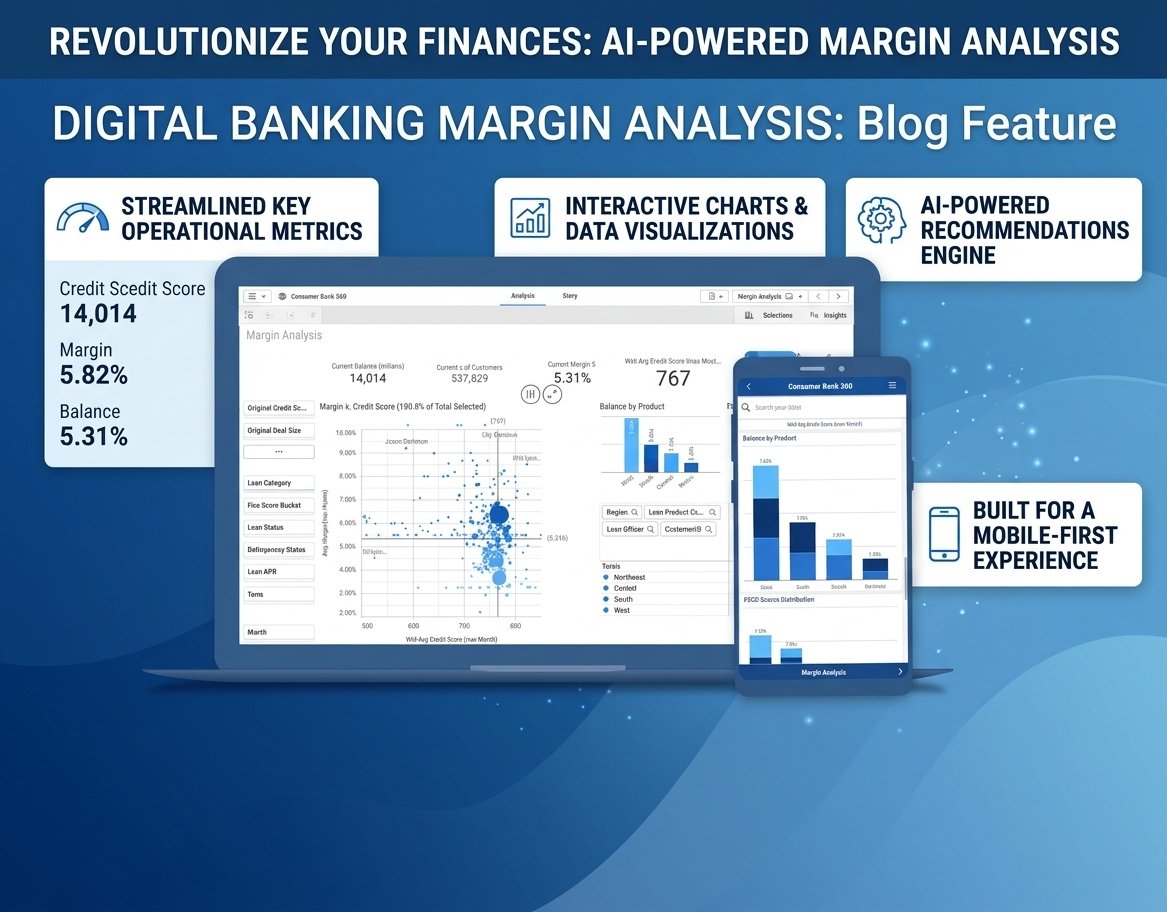
A real estate marketing dashboard brings important marketing and lead performance information together, helping agencies understand what is happening across their digital channels.
In this guide, we explore the metrics a real estate marketing dashboard should include and how agencies can use this information to make better marketing decisions.
Why Do Real Estate Agencies Need a Marketing Dashboard?
Real estate marketing is spread across multiple platforms. Each platform reports performance differently.
For example:
Meta Ads reports impressions, clicks, leads and advertising costs.
Google Ads reports search activity, clicks, conversions and campaign costs.
Google Analytics provides website traffic and engagement information.
Google Search Console shows organic search impressions, clicks and search queries.
A CRM records enquiries, follow-ups, viewing appointments and sales progress.
Looking at each platform separately can make it difficult to understand the complete customer journey.
A centralised dashboard can help answer questions such as:
Which advertising channel is generating the most enquiries?
Which campaign is bringing in qualified property buyers?
How much does each lead cost?
Which property campaign is receiving the most attention?
Are website visitors submitting enquiry forms?
Which marketing sources are contributing to property viewings?
Are advertising results improving or declining?
The purpose is not simply to collect numbers. It is to connect marketing activity with the sales process.
12 Metrics Every Real Estate Marketing Dashboard Should Track
1. Advertising Spend by Platform
Start by monitoring how much the agency spends on each advertising channel.
For example, a brokerage might advertise through:
Facebook and Instagram
Google Search Ads
Google Display and YouTube
TikTok Ads
LinkedIn Ads
The dashboard should show the total spend for each platform and the selected reporting period.
This makes it easier to compare budgets and identify where advertising expenditure is concentrated.
2. Total Leads by Marketing Channel
Lead volume is one of the most important metrics for a property business.
The dashboard should distinguish between enquiries generated by different sources, such as:
Meta lead forms
Google Ads
Website enquiry forms
WhatsApp campaigns
Organic search
Property portals
Direct enquiries and referrals
Do not combine all enquiries into one number without retaining their original source.
Knowing where a lead originated is essential for evaluating campaign performance.
3. Cost Per Lead (CPL)
Cost per lead measures how much advertising expenditure is required to generate an enquiry.
Formula:
Cost Per Lead = Advertising Spend ÷ Number of Leads
For example, if an agency spends AED 3,000 and generates 60 leads, its average cost per lead is AED 50.
However, a lower CPL does not automatically mean better campaign performance. The agency should also examine lead quality and sales outcomes.
4. Cost Per Qualified Lead
Not every person who submits a property enquiry is a suitable prospect.
A qualified lead may have a realistic budget, a clear property requirement, a preferred location and a genuine intention to purchase.
Tracking cost per qualified lead gives agencies a better understanding of whether advertising is attracting relevant prospects.
For example:
| Metric | Campaign A | Campaign B |
|---|---|---|
| Advertising spend | AED 3,000 | AED 3,000 |
| Total leads | 100 | 50 |
| Qualified leads | 10 | 20 |
| Cost per lead | AED 30 | AED 60 |
| Cost per qualified lead | AED 300 | AED 150 |
Campaign A generates cheaper enquiries, but Campaign B generates qualified leads at half the cost.
This is why CPL should never be the only performance indicator.
5. Website Traffic and Landing Page Performance
A property campaign often directs potential buyers to a website or dedicated project landing page.
Monitor:
Total website visitors
Traffic by acquisition channel
Landing page views
Engagement and page activity
Enquiry form submissions
WhatsApp clicks
Phone call clicks
A campaign may attract visitors without generating enquiries. This could indicate a mismatch between the advertisement and landing page, unclear property information or an ineffective enquiry process.
6. Conversion Rate
Conversion rate measures how effectively a landing page or campaign turns visitors into enquiries.
Formula:
Conversion Rate = Number of Conversions ÷ Number of Visitors × 100
For example, if a property landing page receives 1,000 visitors and generates 30 enquiries, its conversion rate is 3%.
Compare conversion rates between different property pages, campaigns and advertising sources to identify opportunities for improvement.
7. Property and Project Performance
Real estate agencies often advertise several properties or development projects simultaneously.
The dashboard should allow performance to be reviewed by:
Property or project name
Community or location
Property type
Campaign
Advertising platform
Reporting period
For example, an agency promoting apartments in Jumeirah Village Circle, Dubai South and Business Bay should be able to compare the marketing performance of each campaign.
This helps the marketing team understand which property campaigns are attracting more attention and enquiries.
8. Creative Performance
Different property advertisements can produce very different results.
One video may generate strong engagement, while another may generate more website visits or enquiries.
Track available creative-level metrics such as:
Impressions and reach
Video views and watch time
Link clicks
Click-through rate
Leads generated
Cost per lead
Conversion rate, where measurable
Compare video walkthroughs, property images, carousel advertisements and lifestyle-based creatives.
This helps identify which formats and messages deserve further testing.
9. Lead Response and Follow-Up
Marketing performance does not end when someone submits an enquiry.
A real estate agency should also monitor what happens after the lead arrives.
Useful CRM metrics include:
New leads awaiting contact
Leads contacted
Unanswered enquiries
Follow-ups due
Viewings scheduled
Leads marked as qualified
Leads lost or closed
These metrics help identify operational issues that advertising reports alone cannot reveal.
10. Property Viewings and Sales Progress
Where CRM data is available, connect marketing sources with sales activity.
Track how many enquiries progress to:
Qualified conversations
Property viewings
Developer meetings
Offers or negotiations
Bookings and completed transactions
This is particularly useful for understanding the difference between campaigns that generate enquiries and campaigns that contribute to actual business opportunities.
A marketing platform cannot independently confirm a completed property transaction unless the relevant outcome data is recorded and connected.
11. Week-over-Week and Month-over-Month Changes
A single reporting period does not always tell the full story.
Compare current and previous periods to understand:
Advertising spend changes
Lead volume changes
Cost per lead changes
Conversion rate changes
Creative performance changes
Qualified lead volume changes
For example, a campaign might generate more leads this month but also have a higher cost per qualified lead.
Trend comparisons help marketing teams identify changes that deserve investigation.
12. Cross-Channel Marketing Performance
Finally, bring the different marketing channels into one reporting view.
A real estate agency may use Google Ads to capture active property searches, Meta Ads to promote new developments, organic search to attract long-term traffic and social media content to build brand awareness.
Comparing these channels helps the agency understand their individual roles.
Remember that attribution can be complicated. A buyer may discover a property through Instagram, search for the agency on Google later and eventually enquire through WhatsApp. A dashboard should preserve available source information and avoid treating every conversion as the result of only one channel.
Example: What a Real Estate Marketing Dashboard Could Look Like
Imagine a Dubai brokerage running campaigns for three different property projects.
Its dashboard could include:
| Dashboard section | Information displayed |
|---|---|
| Campaign overview | Spend, impressions, clicks and leads |
| Lead performance | Total leads, qualified leads and CPL |
| Channel comparison | Google Ads, Meta Ads and organic search |
| Project performance | Leads and campaign results by property |
| Creative analysis | Best-performing videos, images and ads |
| Website analytics | Traffic, landing pages and conversions |
| CRM performance | Contacted leads, viewings and sales stages |
| Trend analysis | Week-over-week and month-over-month changes |
The dashboard should also support date filters and campaign-level comparisons so that marketing teams can investigate performance instead of relying on a single summary figure.
Common Mistakes When Reporting Real Estate Marketing Performance
Even agencies that monitor advertising regularly can make reporting mistakes.
Focusing only on cheap leads
A low cost per lead is not necessarily a sign of campaign success. Always consider lead relevance and sales progression.
Ignoring CRM data
Advertising platforms can report form submissions, but they usually do not know whether a buyer attended a viewing or completed a transaction unless those outcomes are connected.
Comparing different campaigns without context
A campaign promoting a ready apartment and one promoting an off-plan development may attract different buyer profiles and enquiry behaviour. Compare campaigns with their objectives and audiences in mind.
Combining all platforms without checking attribution
The same customer may interact with multiple channels before making an enquiry. Preserve source information and understand the limitations of your attribution model.
Reporting numbers without identifying actions
A useful dashboard should help answer what needs attention. For example, rising costs, declining conversion rates or a drop in qualified enquiries should lead to further investigation.
How Marketing Intelligence Can Help Real Estate Businesses
Managing several advertising platforms and analytics tools manually can become time-consuming, especially for agencies running multiple property campaigns.
A marketing intelligence dashboard can bring connected platform data into a central reporting environment, making it easier to compare advertising activity, analyse creative performance and monitor marketing trends.
Laghavi Marketing Intelligence is designed to help businesses bring marketing performance information from connected platforms into one dashboard. Depending on the integrations and data available, real estate marketing teams can use it to review campaign performance, compare channels and understand changes in their advertising activity.
For agencies that also need help with website development, campaign implementation or CRM integration, Laghavi Digital provides digital marketing and business systems services.
You can explore Laghavi Marketing Intelligence to learn more about the dashboard and its available integrations.
Conclusion
A real estate marketing dashboard should do more than display advertising impressions and clicks. It should help agencies understand advertising expenditure, lead sources, enquiry quality, creative performance, website conversions and sales progression.
The most useful reporting system connects marketing data with business outcomes wherever the required information is available.
By reviewing these metrics consistently, real estate businesses can make more informed decisions about their advertising campaigns and identify where improvements are needed.
Frequently Asked Questions
1. What is a real estate marketing dashboard?
A real estate marketing dashboard is a reporting interface that brings marketing and advertising data together. It can display campaign spend, leads, website traffic, conversions and other performance indicators.
2. What metrics should a real estate agency track?
Important metrics include advertising spend, total leads, cost per lead, cost per qualified lead, website conversion rate, creative performance, property viewings and sales progression.
3. Can I track Facebook and Google Ads in one dashboard?
Yes. Advertising data from connected Meta Ads and Google Ads accounts can be brought into a central dashboard through supported integrations and authorised API connections.
4. Can a marketing dashboard track property sales?
A dashboard can display sales information when it is recorded in a connected CRM or another supported data source. Advertising platforms alone generally cannot confirm completed property transactions.
5. What is a good cost per lead for real estate marketing?
There is no universal ideal cost per lead. It depends on the property price, location, campaign objective, buyer audience, competition and lead quality. Agencies should also measure the cost per qualified lead.
6. Can I compare different property campaigns?
Yes. If campaign and project information is properly organised, you can compare results by project, location, property type, platform and reporting period.
7. Do small real estate agencies need marketing dashboards?
A dashboard can be useful even for a small brokerage. It helps owners and marketing teams monitor spending, enquiries and campaign performance without manually checking several platforms.
8. Can marketing dashboards show which advertisement generates the most leads?
Where the advertising platform provides the necessary data and tracking is configured correctly, a dashboard can compare lead generation at campaign, ad set and advertisement level.
Posted in
Marketing